Enterprise CRM data degrades by 30% every year. I designed a Dynamics 365 workflow that lets teams fix it systematically — not one record at a time.
Vericast runs their account data through Microsoft Dynamics 365. Over time, fields go stale — wrong industry tags, outdated revenue figures, missing websites. Their team was reviewing records manually with no structured workflow, no data source comparison, and no audit trail. A correction that should take 10 seconds was buried in spreadsheet chaos.
Vericast is a B2B data and marketing company. Their sales and operations teams run on Microsoft Dynamics 365 — it's their system of record for accounts. The problem: account data in any CRM decays fast. Companies change industries, revenues shift, websites move, contacts leave.
The brief was to design a data quality improvement workflow embedded directly inside Dynamics 365. The client had a reference video showing a Salesforce-style version of this concept. My job was not to copy it — it was to understand the intent, adapt it thoughtfully to the Microsoft Dynamics environment, and improve the UX where the reference fell short.
The final output was a high-fidelity Figma prototype built on the Microsoft Fluent UI design system — ready for stakeholder communication, product planning, and executive review.
The constraint that shaped everything: this had to feel like it shipped with Dynamics 365 — not like a third-party tool bolted on top. Every component, pattern, and interaction had to be native Microsoft.
Data quality issues were caught ad hoc — someone noticed a wrong field and fixed it manually, or it was missed entirely. There was no queue of cases to work through systematically.
When a field looked wrong, there was no easy way to check what Zoom, Dun & Bradstreet, LinkedIn, or Wikipedia said about the same account — each required a separate browser tab and manual copy-paste.
All account records were treated equally. Tier 1 strategic accounts (highest revenue impact) sat in the same unsorted pile as low-value records, so teams couldn't focus effort where it mattered most.
When adding a new account, there was no check against existing records or external databases. Teams would create duplicates, or worse, onboard the wrong entity entirely.
Four hard constraints governed every design decision on this project:
Fluent UI components only. No custom widgets, no external libraries. Every button, grid, tab, dialog, and command bar had to exist in the official Microsoft 365 component toolkit — or it didn't exist in the product.
No direct database access. All four external data source columns (Zoom, D&B, LinkedIn, Wikipedia) came from pre-existing API connections. The design had to work gracefully with missing or inconsistent data from any of them.
Mandatory confirmation on all bulk actions. Any approve-all or bulk-apply action required an explicit confirmation dialog — a non-negotiable stakeholder requirement to prevent accidental mass data overwrites.
Figma prototype only, not an engineering handoff. The output was a high-fidelity prototype for executive review and stakeholder sign-off — not a dev-ready spec. This meant prioritising communicating the workflow over edge-case completeness.
The reference was a Salesforce-style workflow. Salesforce and Dynamics 365 have fundamentally different interaction patterns — what feels native in one feels wrong in the other. Directly copying the flow would have produced something that worked on paper but felt foreign to users already living in Microsoft 365.
My approach was to map the intent of each screen in the reference — what decision is the user making here? — then find the right Dynamics 365 pattern to support that same decision. That meant using command bars, tabs, grid views, and side panels exactly as Microsoft specifies them, not inventing new patterns.
"Native first" — if a Dynamics 365 user couldn't look at this and assume it shipped with the product, the design wasn't done.
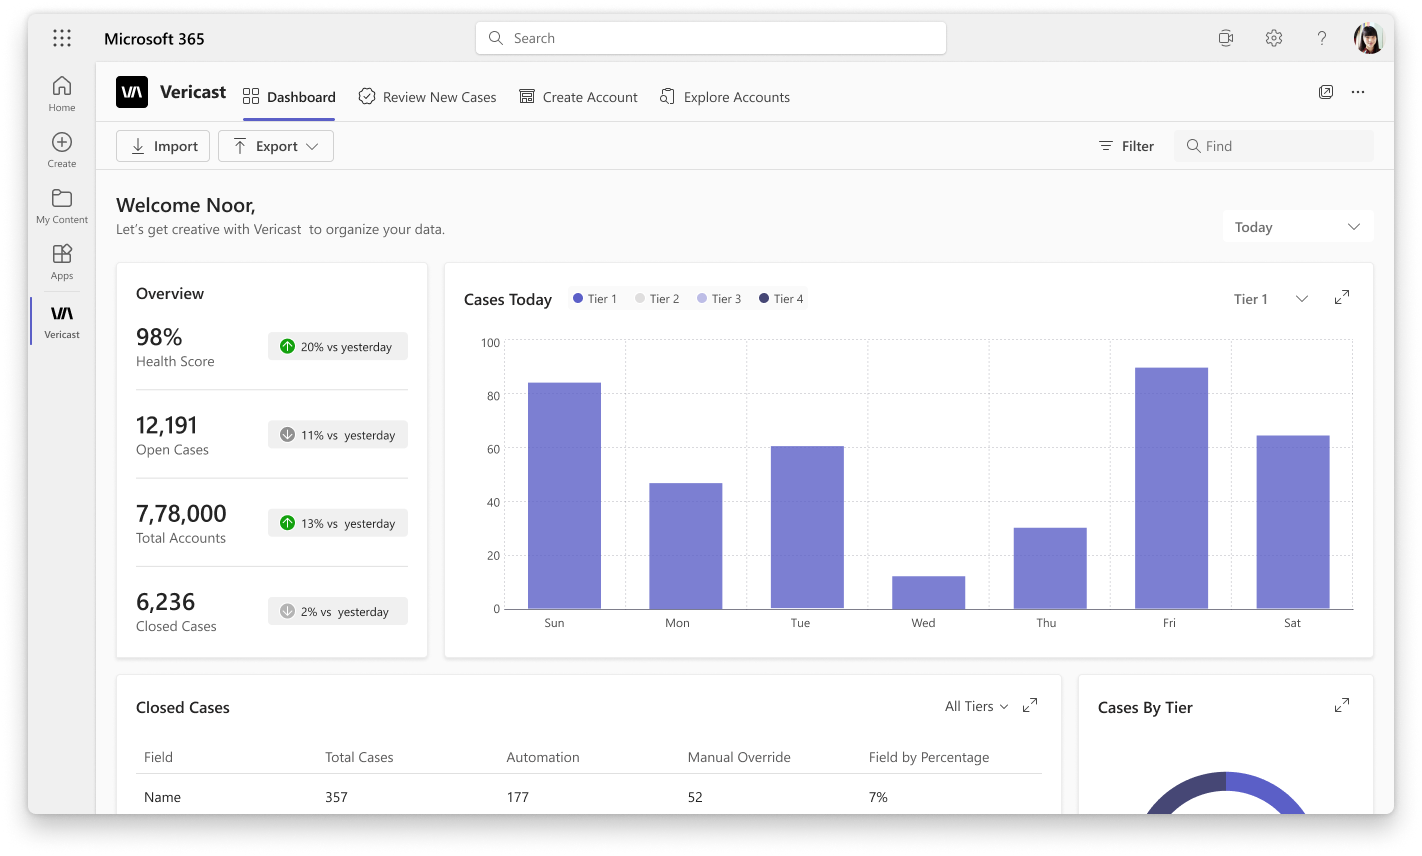
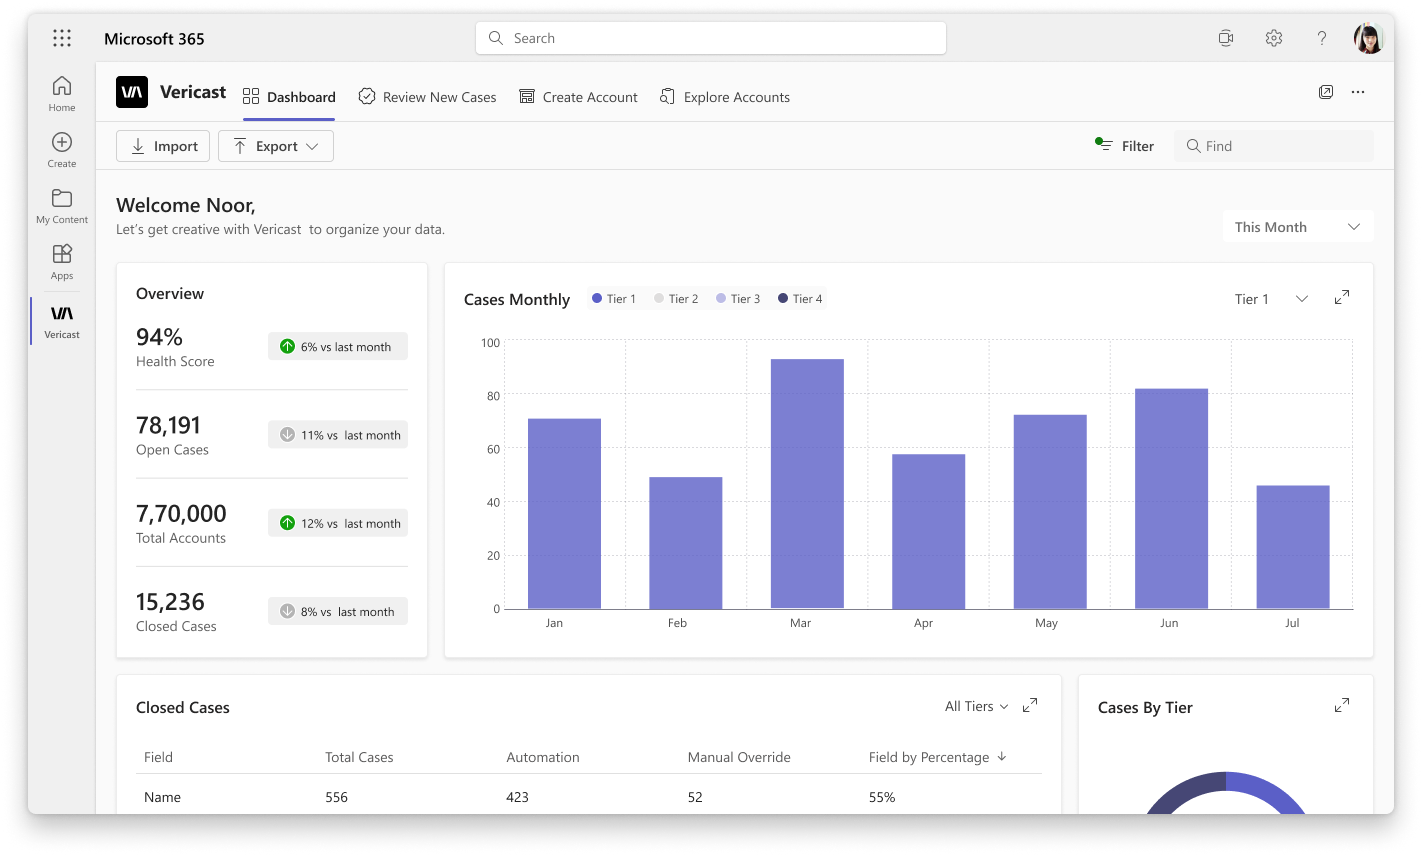
What I changed: The app is divided into four distinct tabs — Dashboard, Review New Cases, Create Account, and Explore Accounts. Each module owns a specific job. You don't land in a generic "data" view and figure out what to do next.
Why: Data quality work involves very different mental modes — monitoring (Dashboard), triaging (Review), creating (Create Account), and auditing (Explore). Separating them reduces cognitive switching and makes it clear where to go for any task.
Problem solved: Users no longer have to scroll and filter the same screen for different jobs. The tab navigation itself communicates the workflow.
The four-tab top bar establishes the full scope of the tool at a glance — matching Dynamics 365's standard app navigation pattern
What I changed: The Review Cases view has tabs for All Tiers, Tier 1, Tier 2, Tier 3, and Tier 4. Users can work their way through the most critical accounts first without needing to set filters each session.
Why: The reference design had no concept of prioritisation — all records were in one flat list. But in practice, a Tier 1 enterprise account with wrong revenue data causes far more damage than a Tier 4 record. The tabs make prioritisation the default, not an afterthought.
Problem solved: A team lead can assign "work Tier 1 first today" without any setup — the tab structure enforces that workflow for everyone.
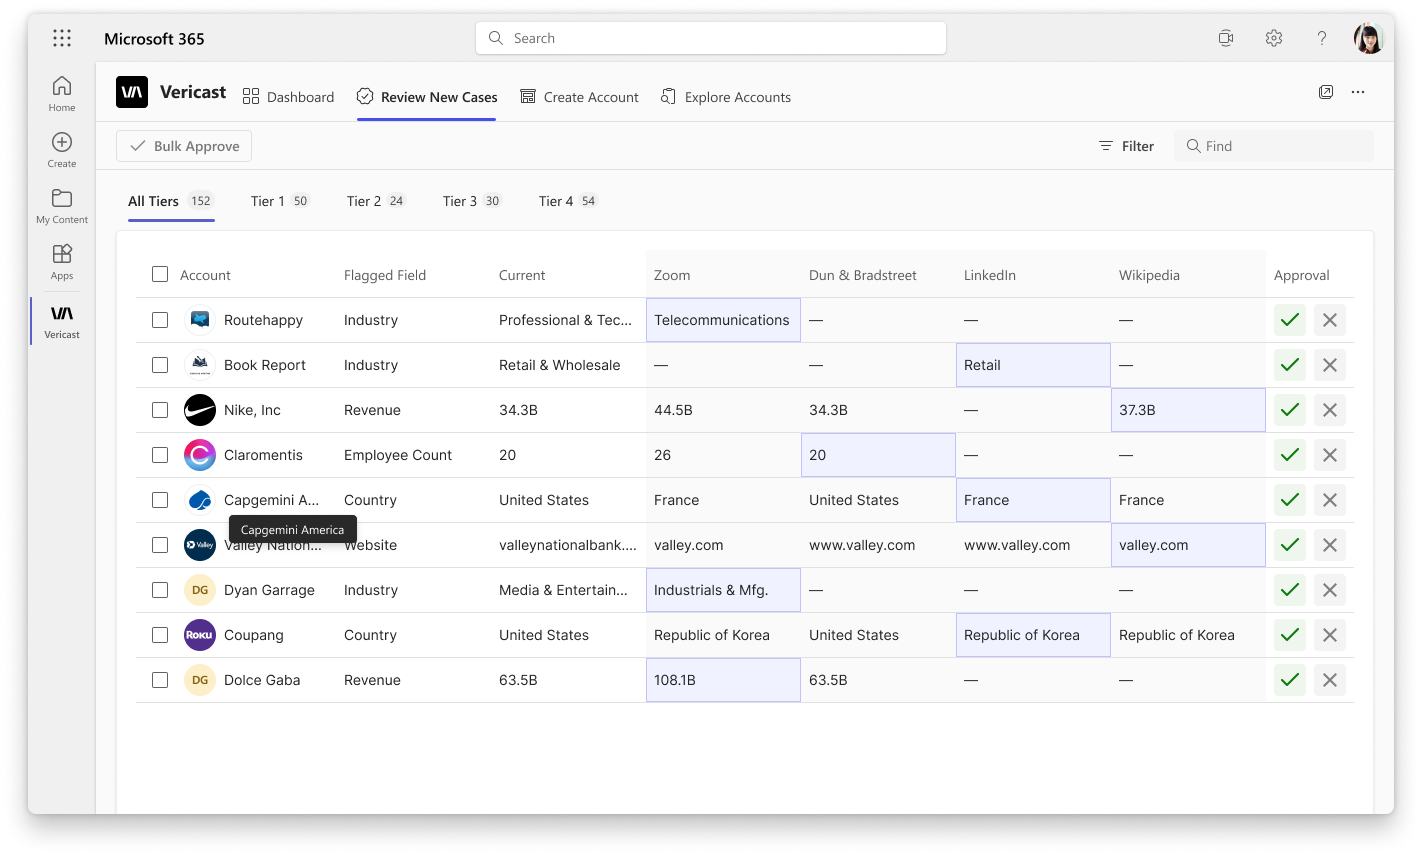
Tier tabs across the top — the review grid shows Current data alongside Zoom, D&B, LinkedIn, and Wikipedia columns for direct comparison
What I changed: Each case row in the review grid shows the Current value alongside what Zoom, Dun & Bradstreet, LinkedIn, and Wikipedia report for the same field. The approval action (✓ or ✗) sits at the end of the row.
Why: The old workflow required opening each external source in a new tab, reading the data, switching back to Dynamics, and updating the field. By pulling all sources into the grid, the decision is made on the same screen with no context switching.
Problem solved: Eliminated the browser-tab juggling that was slowing down every single review. The full picture is on the row — approve or reject is now a one-click decision.
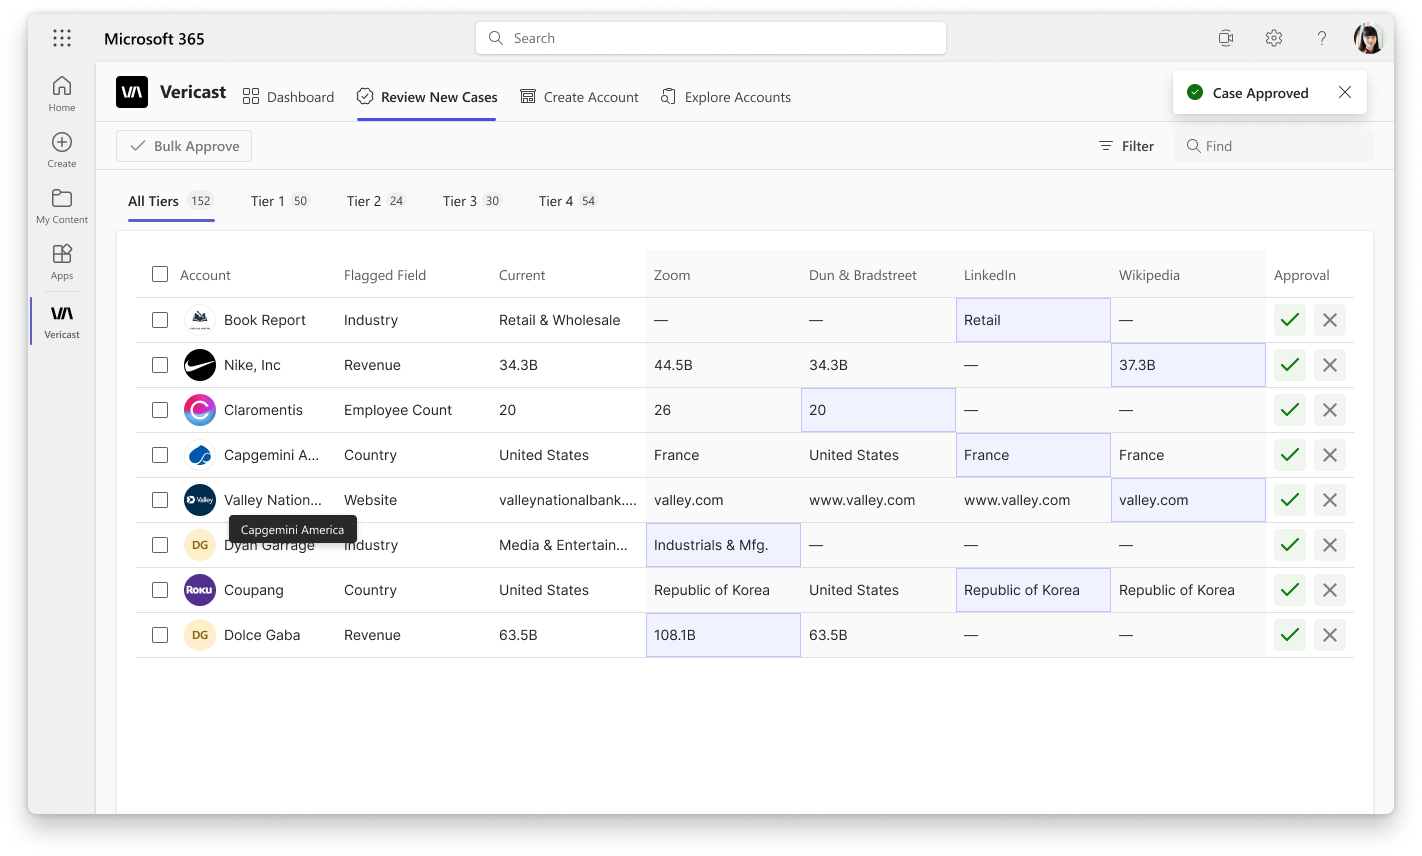
One click on the approve action fires the "Case Approved" confirmation toast — the row updates in place, no page reload.

Rejecting a case marks it as closed — the record is flagged but preserved for audit, not silently deleted.
What I changed: Checkboxes on each row let users select multiple cases at once. A sticky "Bulk Approve" command appears when rows are selected, approving all in a single action. "Cases Approved Successfully" confirms the batch.
Why: Not every data quality case needs deep scrutiny. When all four sources agree on a value, approving 20 records individually is pure overhead. Bulk approval is the right tool for high-confidence corrections.
Problem solved: Review sessions that took an hour can be completed in minutes when straightforward cases can be batch-processed.
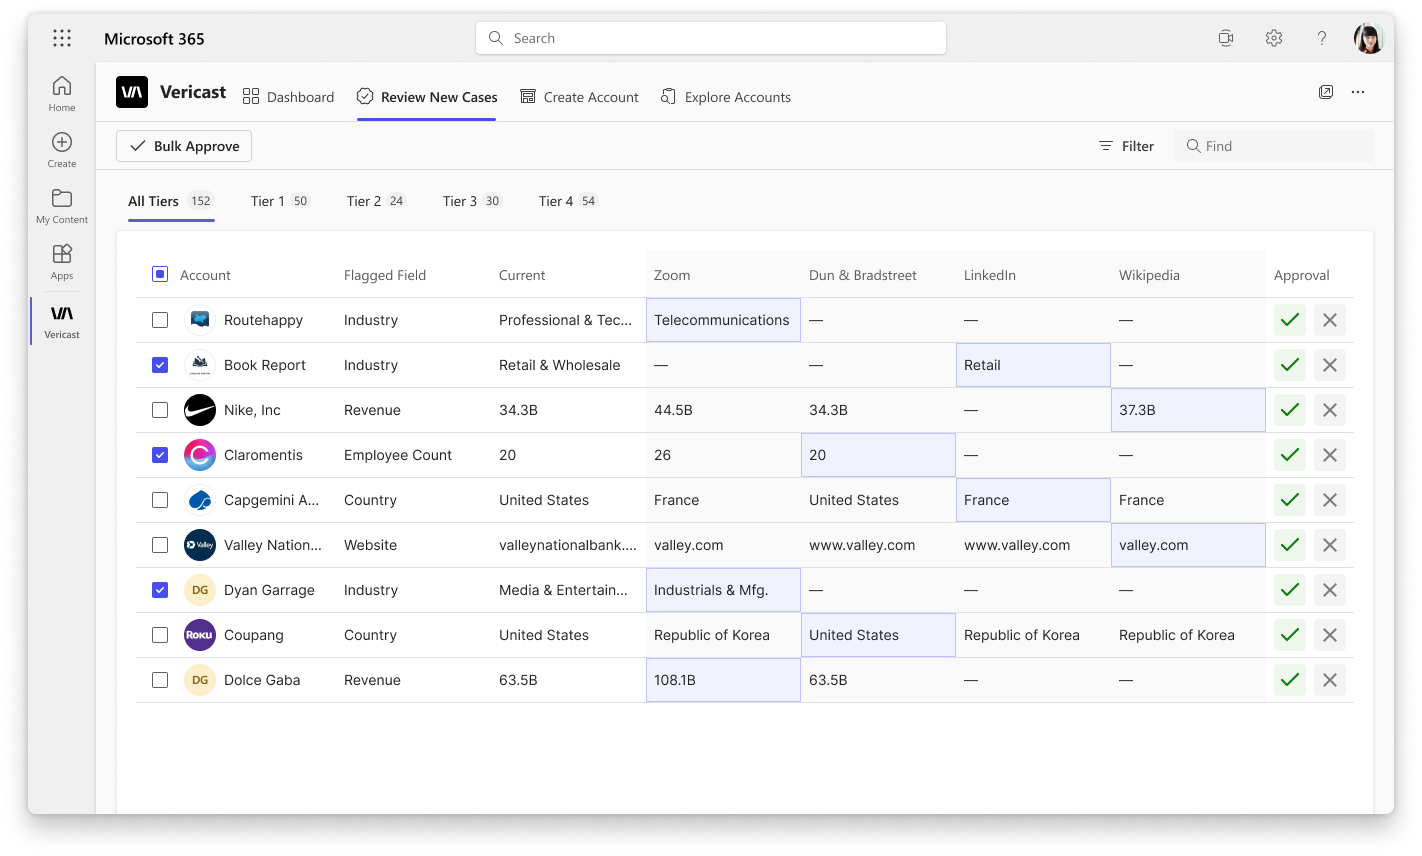
Checkboxes on each row — select all or pick individually. The command bar activates "Bulk Approve" once a selection is made.
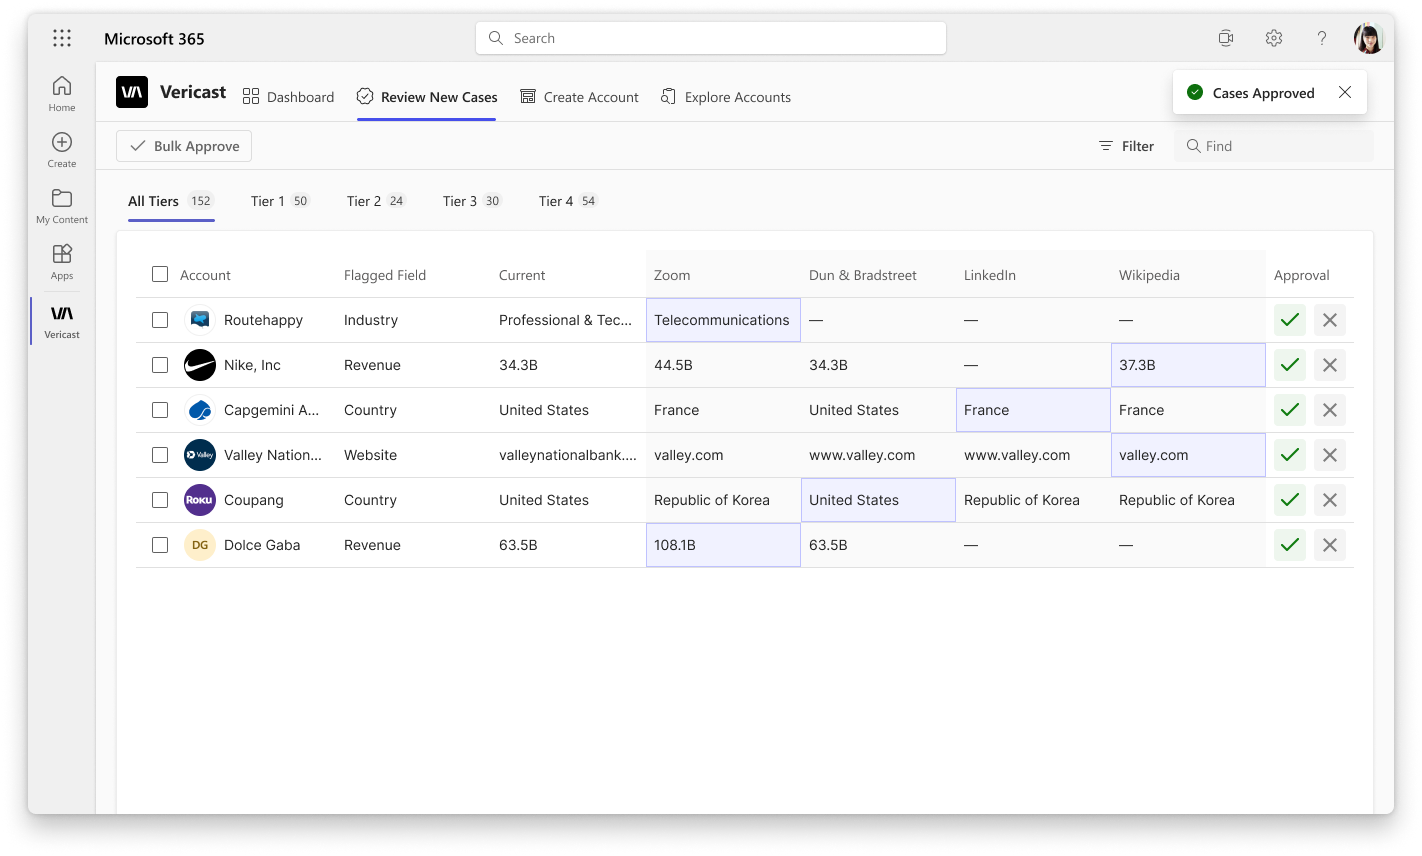
"Cases Approved Successfully" toast confirms the batch. All selected records updated in one action.
What I changed: When creating an account, the search returns results ranked by match percentage (e.g. 79%, 53%, 38%) alongside Billing Country and City. A radio-button selection model forces the user to pick one explicit match before creating.
Why: Without scoring, similar company names look identical in a list. "Book Happy" and "Book Report" both match a search for "Book" — but 79% vs 53% tells the user something meaningful about confidence before they commit to creating the account.
Problem solved: Duplicate account creation and accidental entity mix-ups — two of the most common data quality failures in CRM systems.
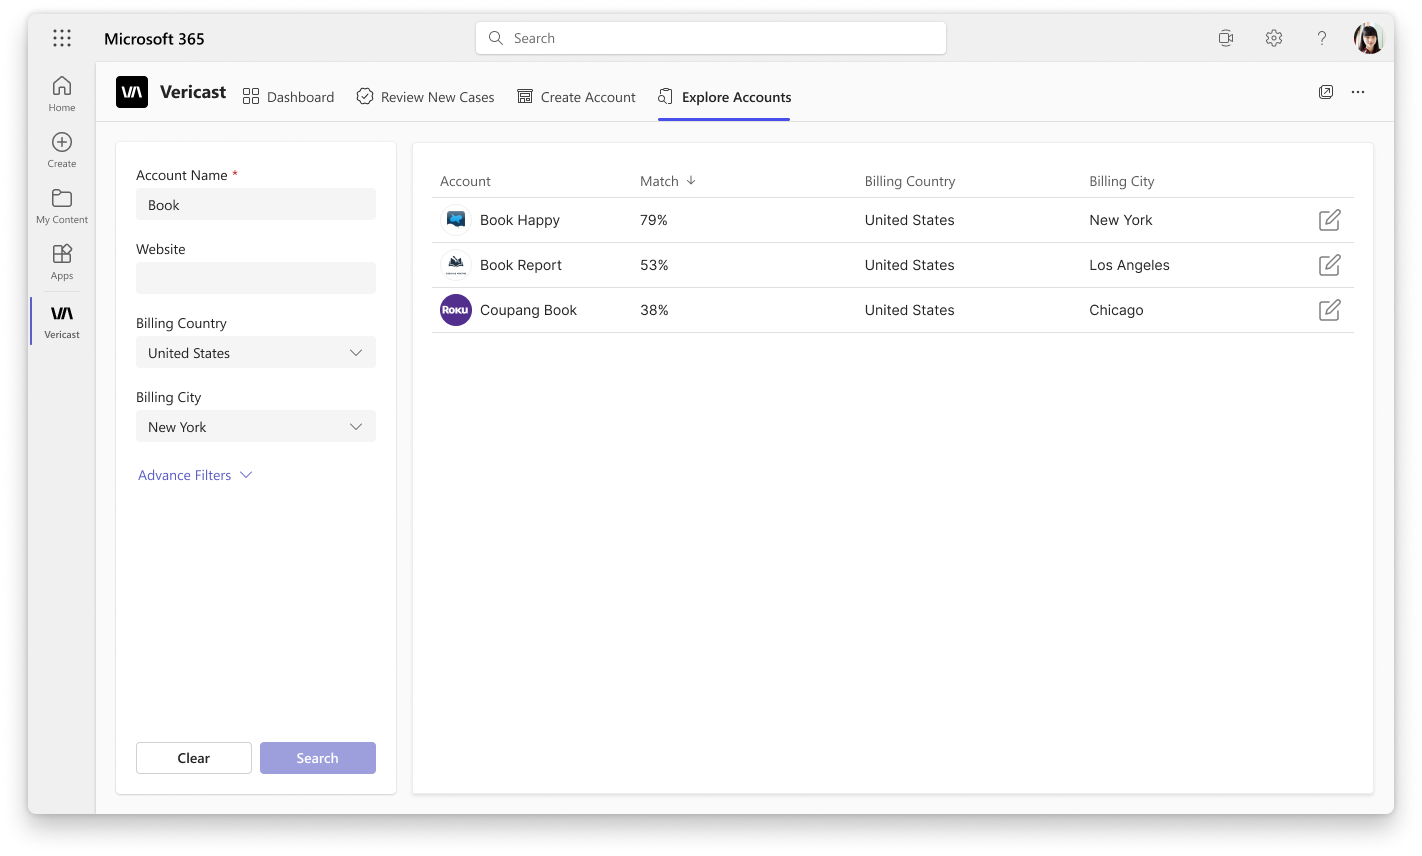
Search results ranked by match confidence — 79%, 53%, 38% — with Billing Country and City for disambiguation
The brief included a Salesforce-style reference video. Here's how I turned that into a native Dynamics 365 design.
Watched the Salesforce reference, mapped each screen to a user decision: "what is the user choosing here?" — not "what does this screen look like?"
Identified which Dynamics 365 / Fluent UI components map to each interaction: command bars for actions, tab bars for module nav, grid views for data tables, side panels for edit.
Defined the 4-module structure (Dashboard, Review, Create, Explore), established data flows between them, and validated the navigation model against Dynamics conventions.
Built every state — empty, loaded, searched, approved, bulk-selected, saved — using Fluent UI components. Connected as a working prototype for stakeholder walkthrough.
The dashboard opens with a "Today" view: 98% case success rate, 12,191 open cases, 7,78,000 total records, 6,236 closed cases. The bar chart breaks down cases by tier, updated for the selected time window.
A welcome message personalises the experience — the tool knows who you are and opens ready to work, not with a blank state.
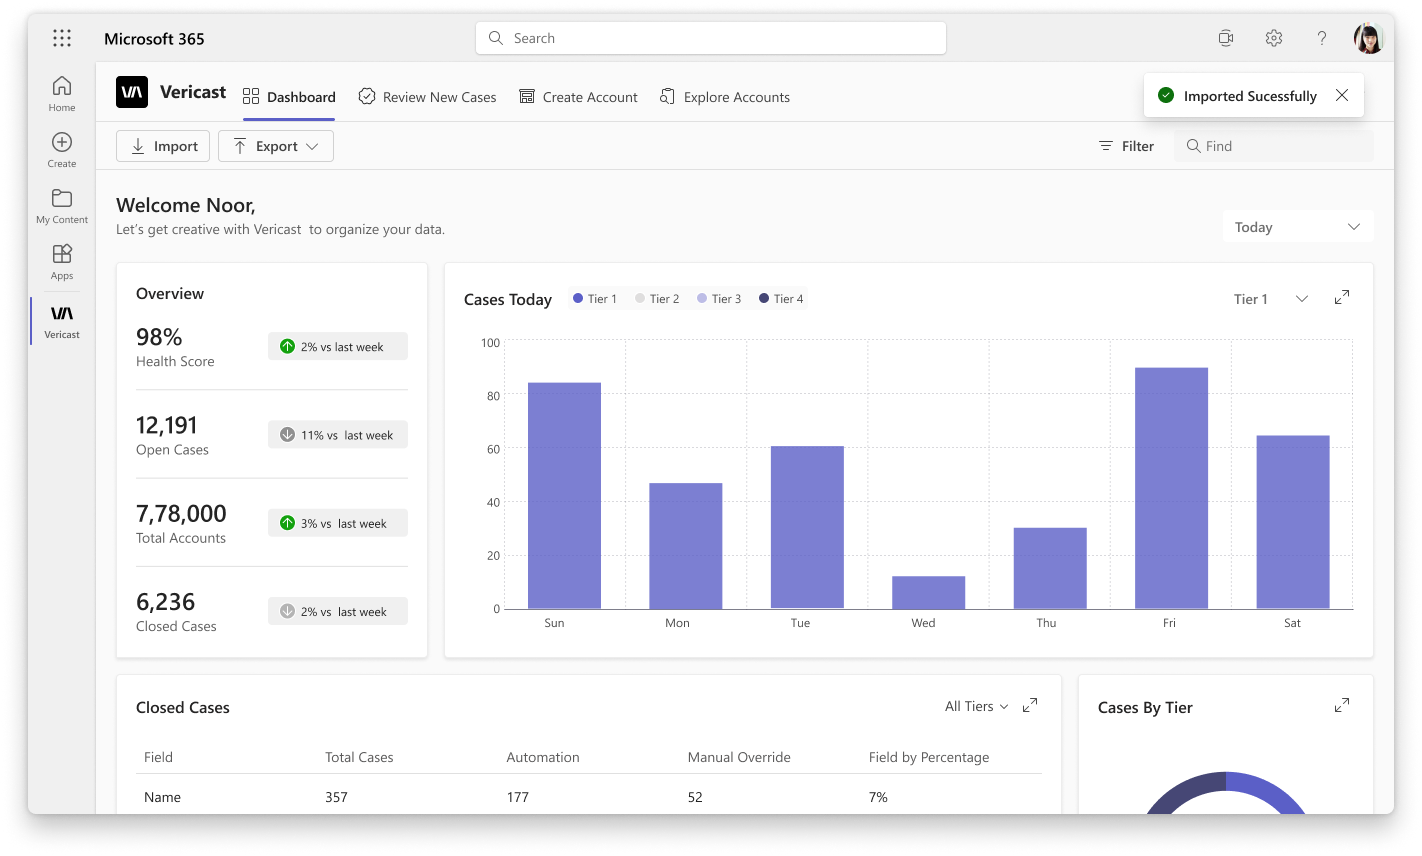
The Import button on the command bar lets users upload a CSV or JSON file. Once uploaded, the system previews the data before committing. The "Imported Successfully" toast confirms the operation.
This was an addition the reference didn't include — data teams frequently need to bring in processed datasets from external enrichment tools.
Every KPI card compares to the previous period. Switching the filter updates the chart and the comparison deltas — "↑ vs last week" or "↓ vs last month" — so managers understand trend direction without running a separate report.
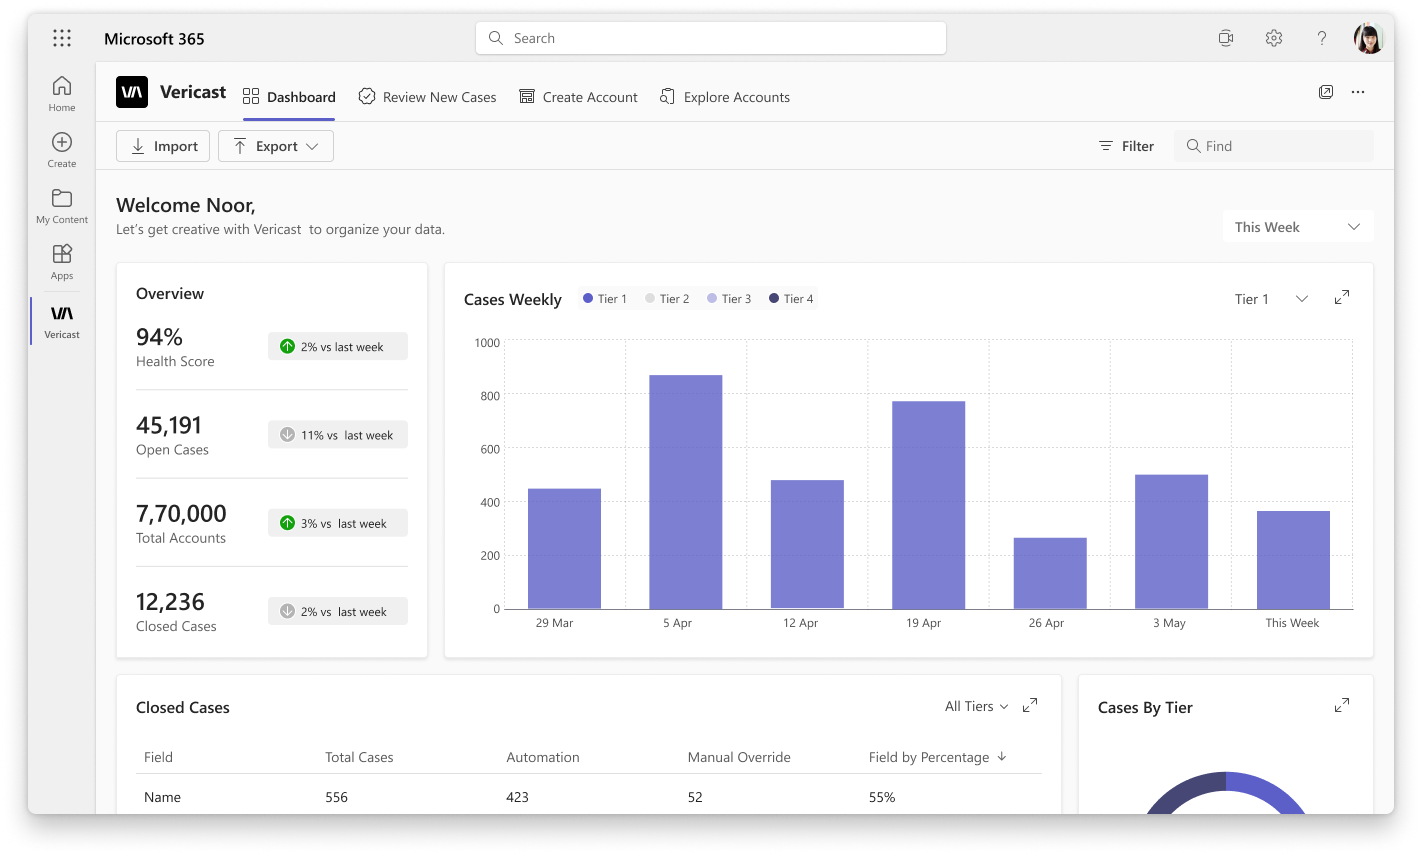
45,191 open cases compared to last week — weekly bar chart with tier breakdown. Useful for sprint-level planning.
Monthly view for leadership reporting — 15,236 closed cases vs last month, trend direction visible at a glance.
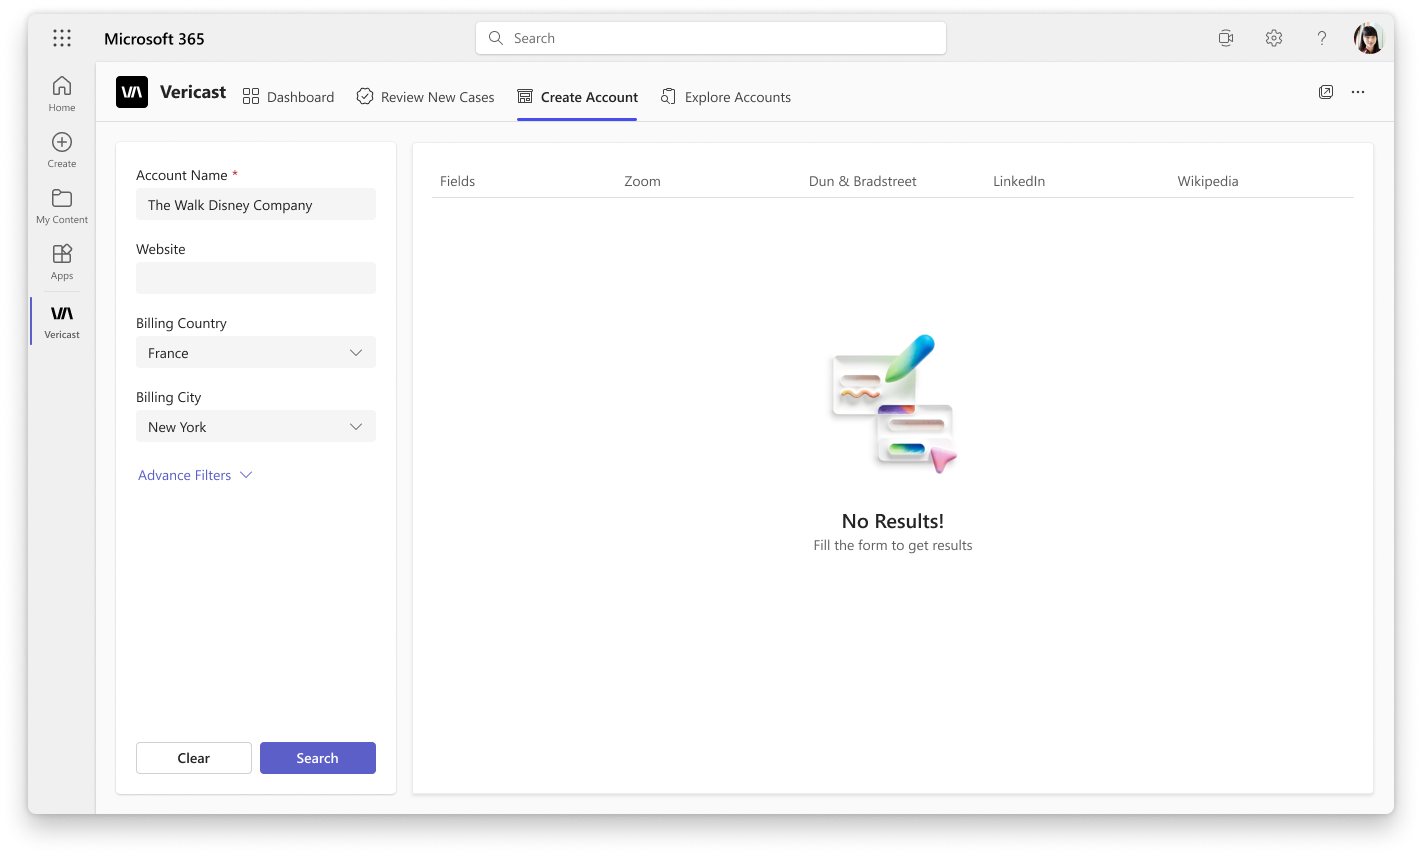
The Create Account screen is intentionally empty on load — users must search first. Account Name, Website, Billing Country, and Billing City define the search. Advanced Filters expand for more precise matching.
The "No Results — Fill the form to get results" state is direct: don't create anything until you've checked what already exists.
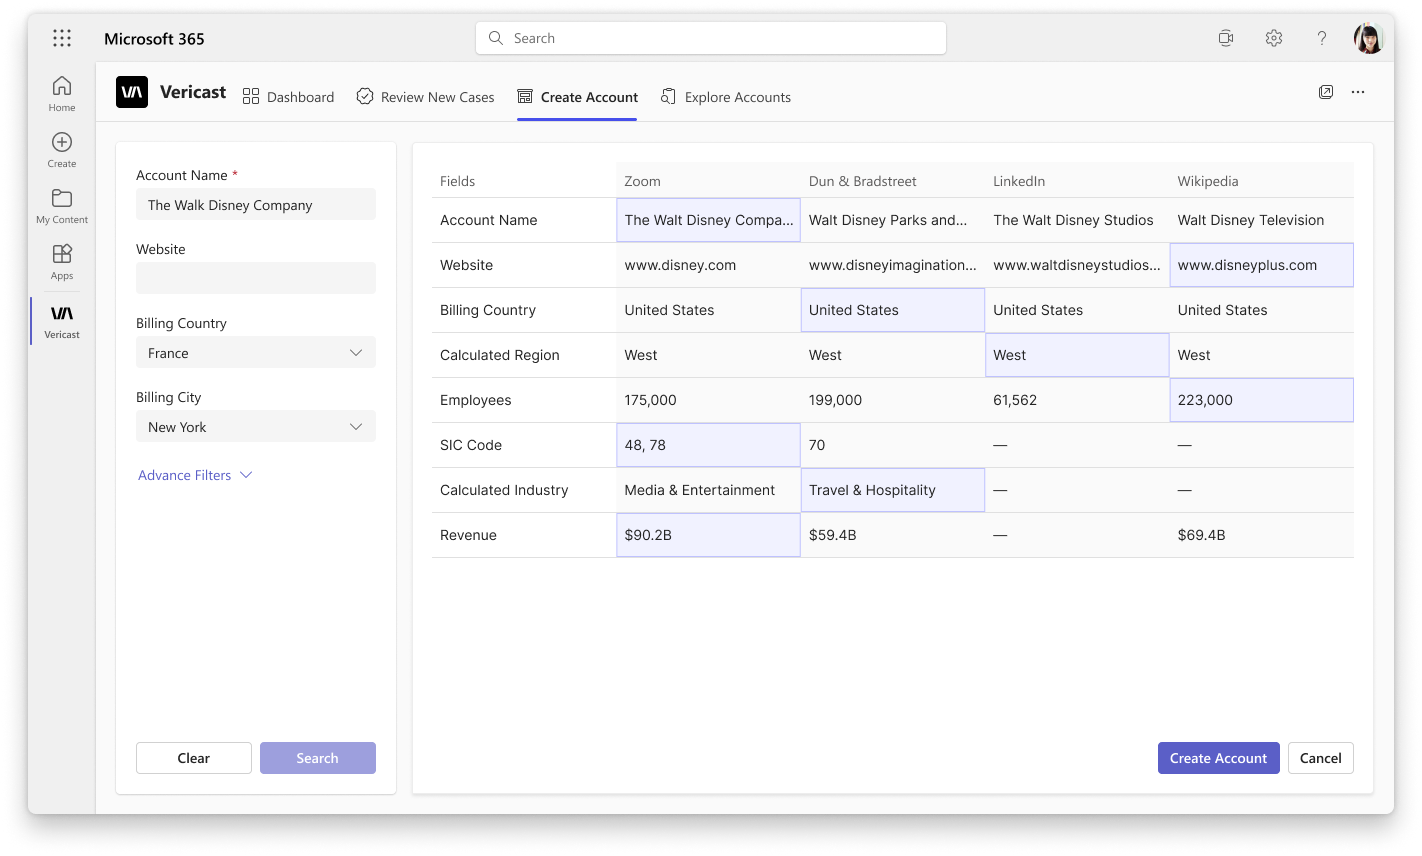
After searching "The Walt Disney Company", results appear from Zoom, D&B, LinkedIn, and Wikipedia side-by-side. Each column shows what that source reports: website, employees, SIC code, industry, revenue.
A radio-button selection forces one explicit choice. "Create Account" activates only after a source is selected — preventing blind creation.
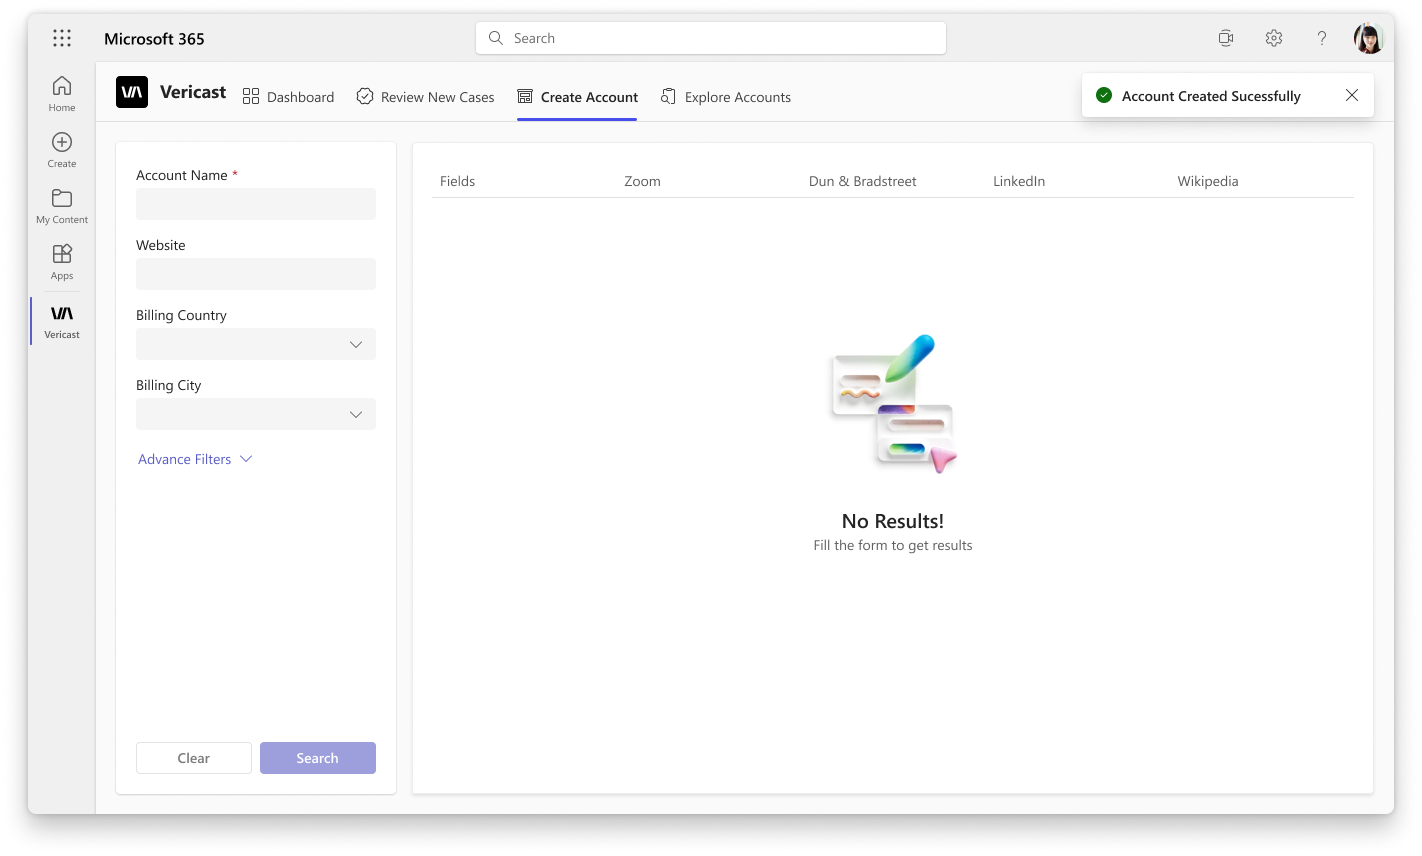
After creation, the form resets to empty — the user is ready for the next account. The "Account Created Successfully" toast confirms the action without blocking the next workflow.
No modal, no redirect, no disruption — consistent with how Dynamics 365 handles confirmations throughout the product.
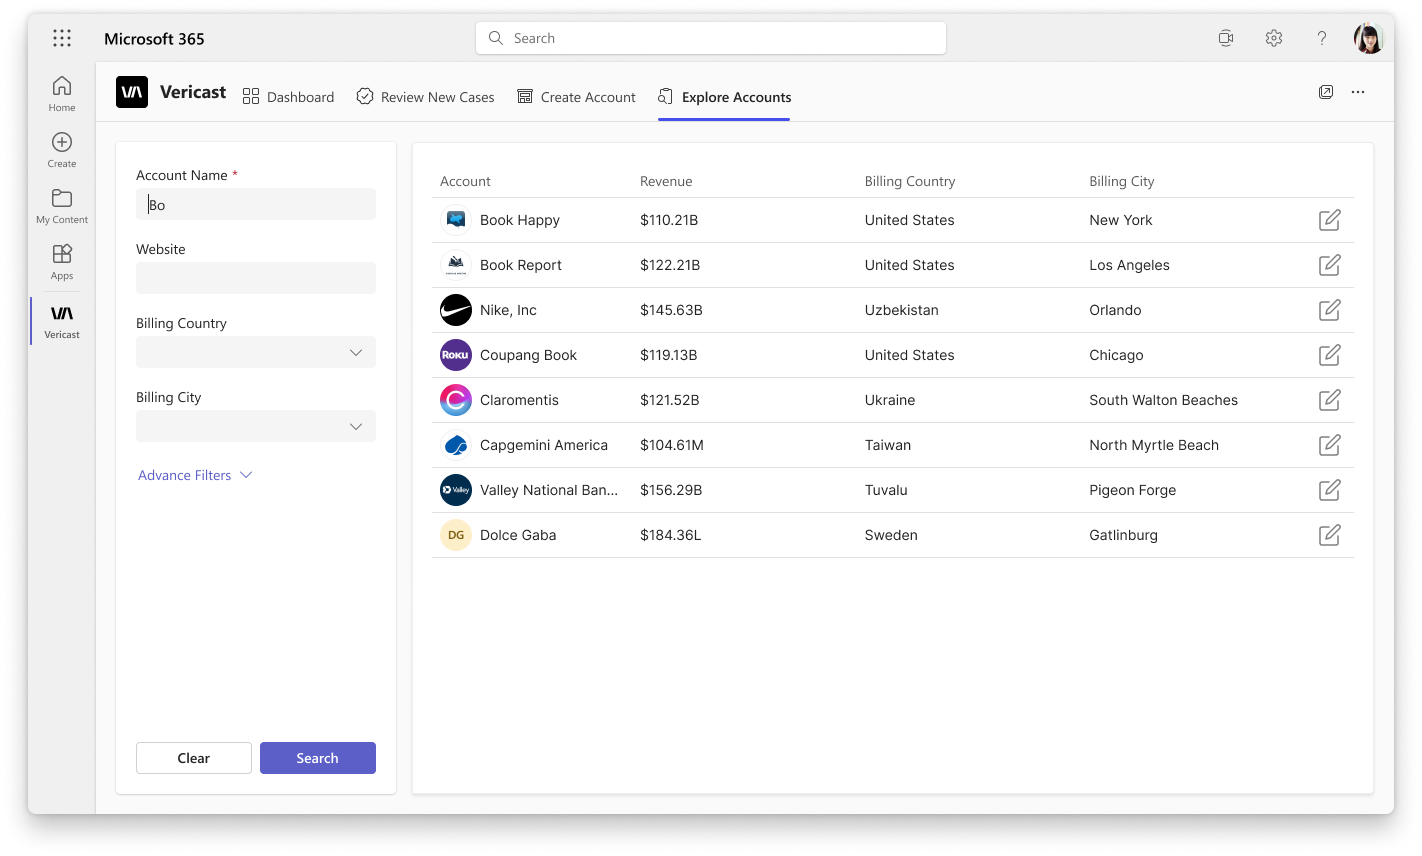
All registered accounts display by default — Account name, Revenue, Billing Country, Billing City. The search panel on the left accepts Account Name, Website, Billing Country, and City to narrow the list.
This is the auditing module: find any account, check its data, edit it if needed — all without leaving Dynamics.
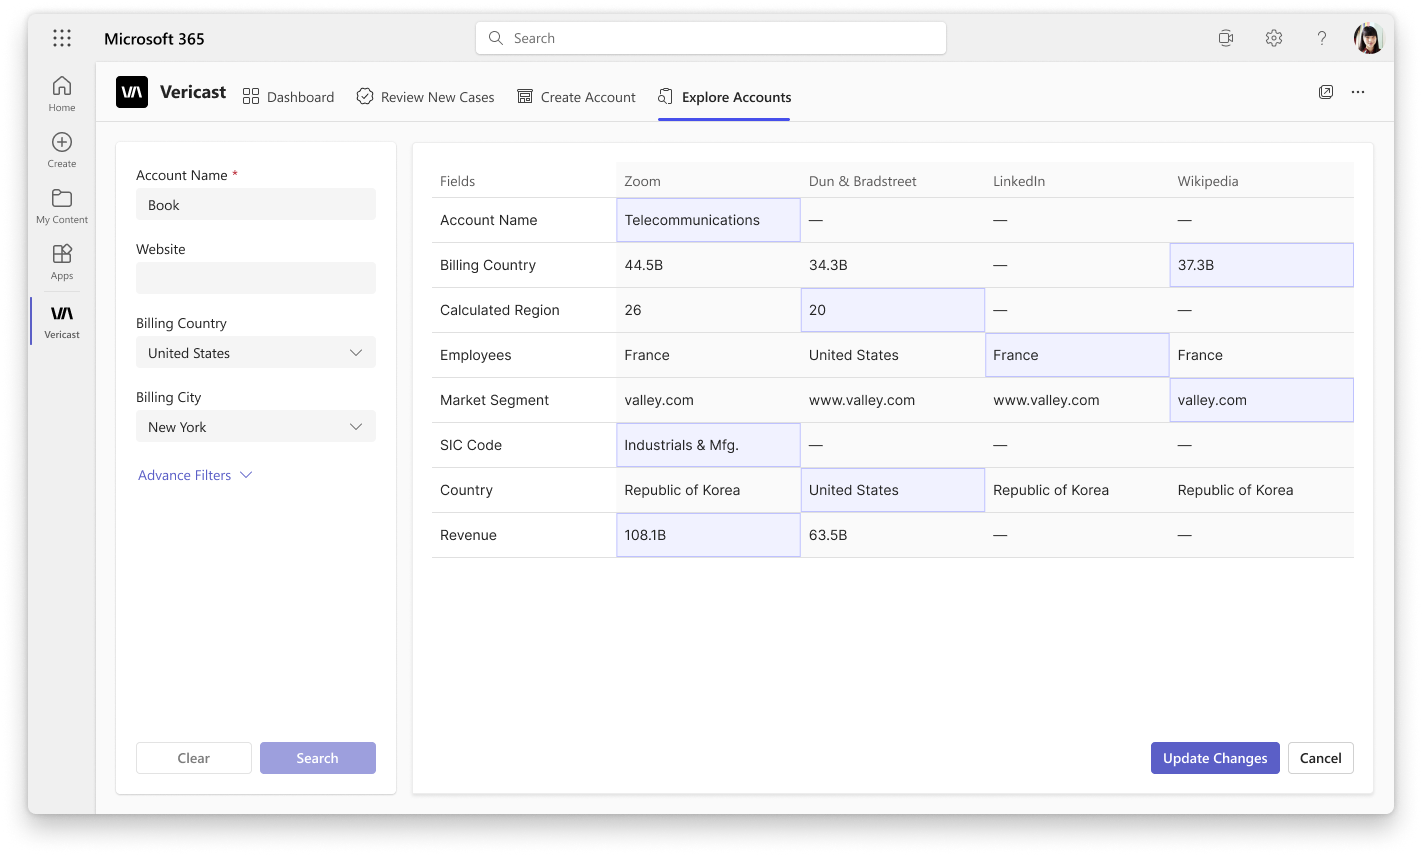
Clicking edit on any account opens a multi-source comparison view — Zoom, D&B, LinkedIn, and Wikipedia columns show what each source reports for Billing Country, Calculated Region, Employees, SIC Code, and Revenue.
"Update Changes" commits the edits. "Changes Saved Successfully" confirms. The workflow matches exactly what users see in the Review Cases module — consistent mental model across the whole tool.
Zoom, D&B, LinkedIn, and Wikipedia data brought into a single grid row. No tab switching during review.
Cases where all sources agree can be batch-approved in seconds — hours of manual review compressed into minutes.
Tier tabs mean highest-impact accounts get reviewed first — no filter setup required, every session.
Built entirely on Fluent UI — existing Dynamics 365 users operate it from day one with no training overhead.
The first design was a step-by-step wizard: one field per screen, pick a source, confirm, advance to the next field. For four fields, that was four separate confirmation screens per record — clean in isolation, painful at volume.
In a stakeholder walkthrough, the operations team lead flagged it in under two minutes: "I need to see the whole record to judge which source is most trustworthy overall — not just for one field at a time." A data quality reviewer doesn't make four independent micro-decisions; they make one holistic judgment about which external source best represents this company. The wizard made that judgment impossible.
Why we cut it: The wizard optimised for simplicity per step at the cost of judgment across steps. Replaced with the side-by-side multi-source comparison table — all fields visible at once, all sources visible simultaneously, one selection decision per record.
AI-suggested corrections — when 3 of 4 data sources agree on a value that differs from the current record, surface a "Suggested Fix" flag directly on the row. This would further reduce the cognitive load of reviewing each case individually and turn the tool from reactive to proactive.
The multi-source column layout works cleanly for a small number of fields — but as the number of tagged fields grows, the grid becomes wide and hard to scan. A collapsible "show differences only" toggle would help users focus on the columns that actually diverged between sources.
Designing for an existing platform isn't a constraint — it's a shortcut. When you use the host system's components faithfully, you inherit years of UX decisions your users already trust. The real design work is knowing what the platform does well and spending your energy on the parts it doesn't cover — the data comparison logic, the prioritisation model, the confirmation states.